Resorts—Datavisualization about ski areas

Task
Resorts is a project from the basic subject programmed design 2 of the second semester. It deals with the visualization of large data sets relating ski areas. The task was to create a system without alphanumeric characters. The user should only get informations through the forms, colours, animations and interactions.
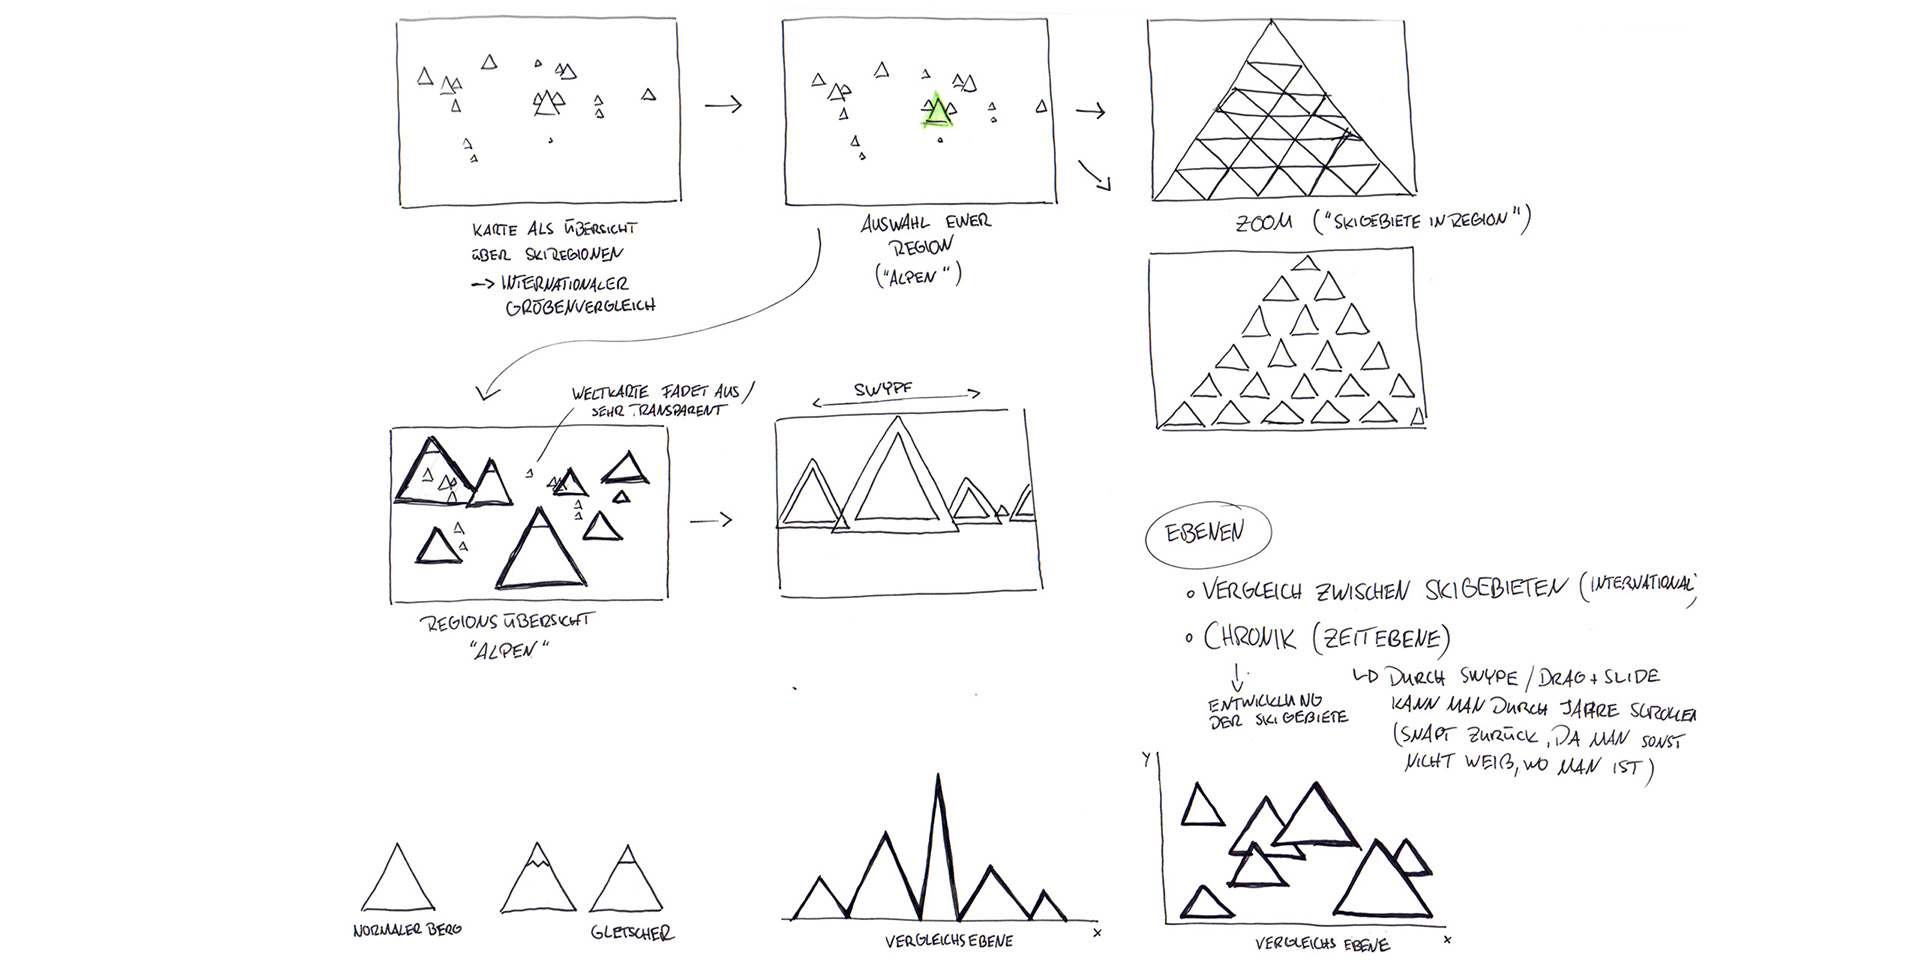
Regions
The world map is the startscreen. It gives the user an overview of all ski regions worldwide. Every opaque triangle represents a region which contains on or more ski areas. The user is able to select a region to the comparison/detailed level below the world map by clicking on a triangle.

Region comparison
If the user selects another region, he can compare them with eath other. The visualized values summarize all ski areas within the region and are therefore average values.

Parameters
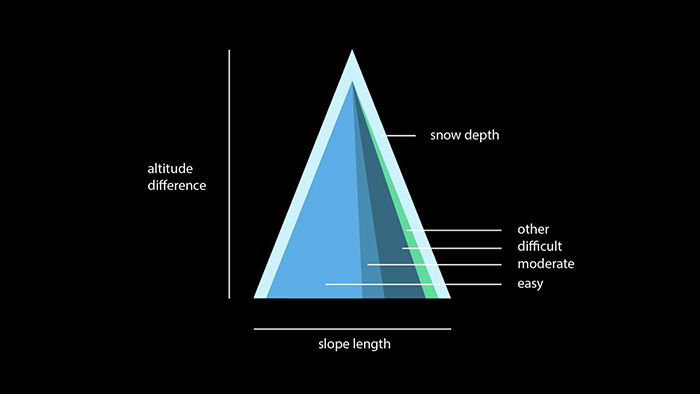
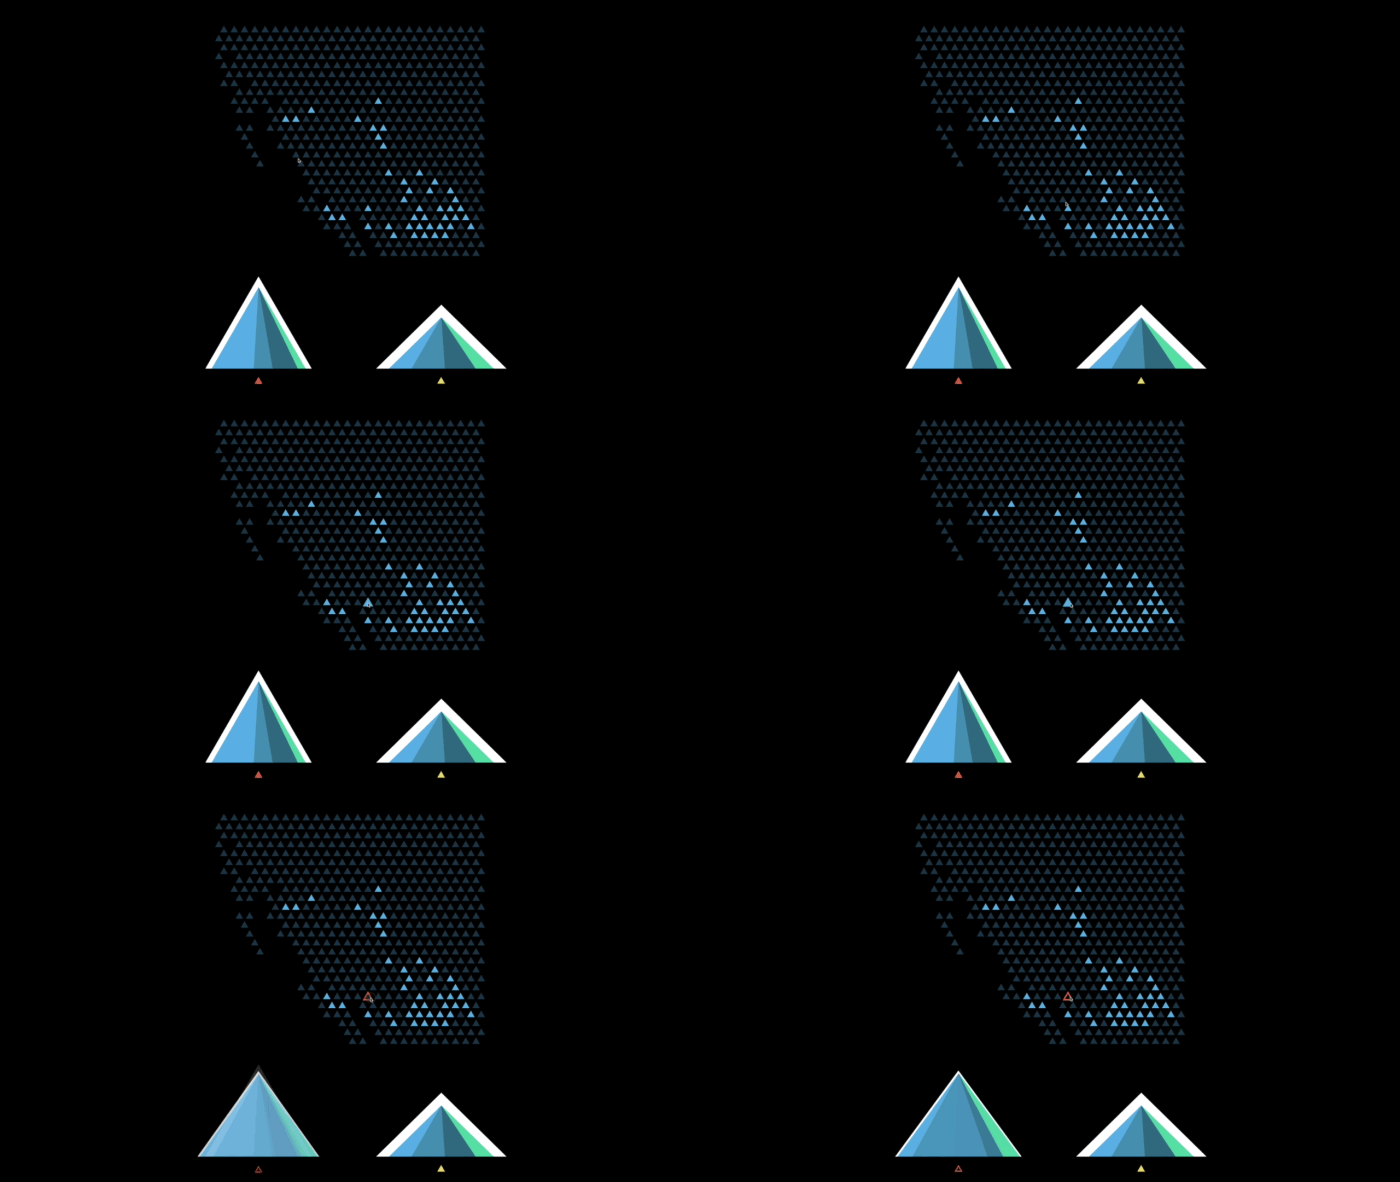
The triangle as a basic geometric form represents a mountain. The white outline pictures the snow layer. The whole shape is defined by the total slope length (base) and the difference in height between the peak and the valley (height). A visualization of the slopes diffulty levels shows the filling, which also gives the triangle a three-dimensional look.
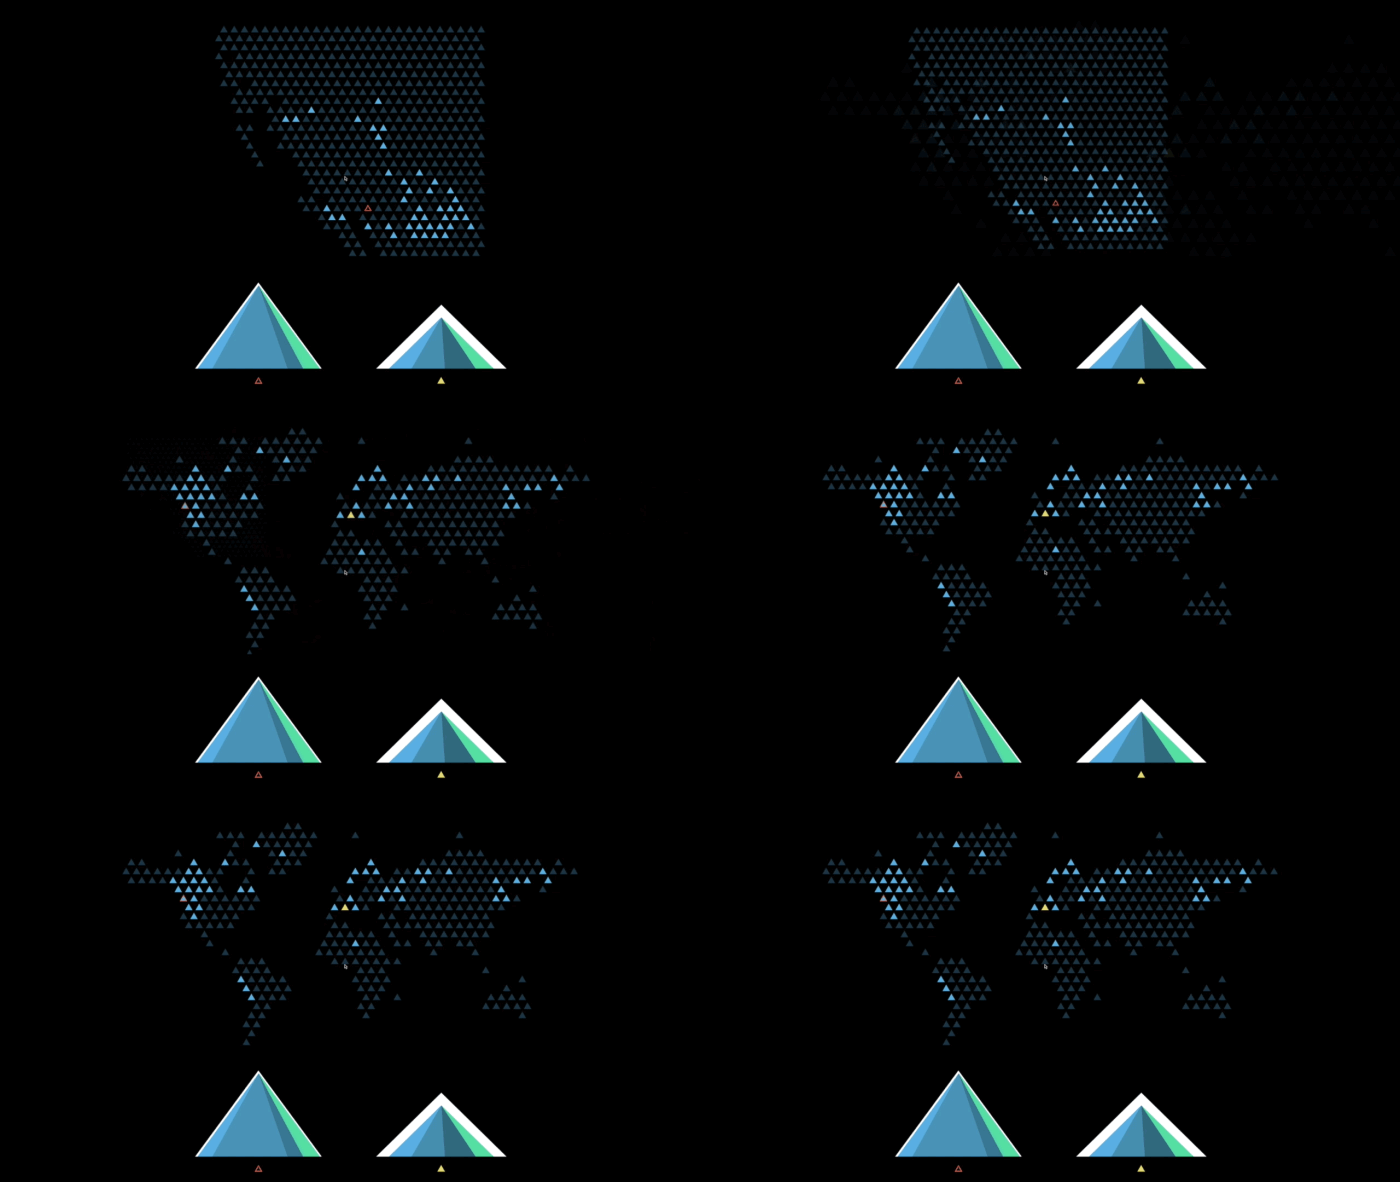
Resorts
By hovering over a region and scrolling, the user gets from the world map into the resorts map. Now each triangle represents a single ski area.
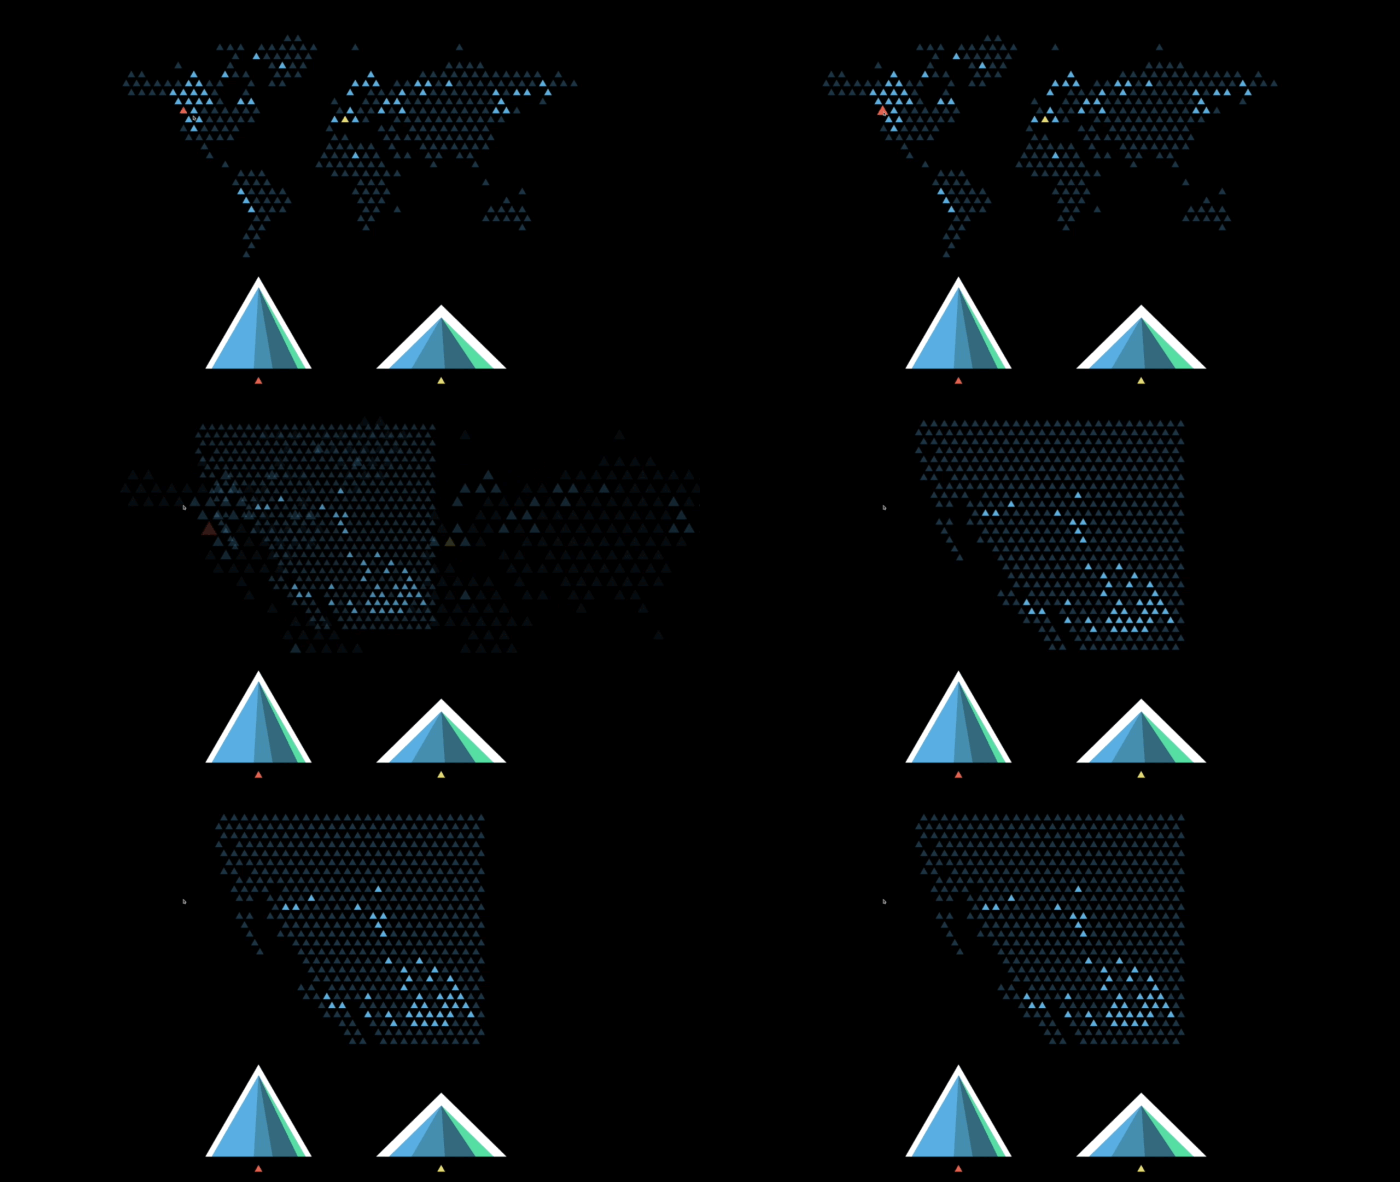
Region – resort
The open navigation of the system enables the user to compare regions with regions, areas with areas and regions with areas. A selected area is represented in the comparison level by a highlighted, outlined triangle.
Navigation back
Another scroll event takes the user back to the world map. The highlight of the selected regions changes from an outlined to a filled triangle with outline.
All shown animations are screencasts of a prototype made with framer.js.
